


 |
|
|||||||||||||||||||||||||||||||||
|
|
||||||||||||||||||||||||||||||||||
 |
Usability Testing in the Lab: Multiple prototypes of a Redesigned SprintPCS.com Home Page Overview 
The goal of the study was to perform usability testing on several designs of the SprintPCS.com Home page. Both objective and subjective measures would be assessed. A comparative evaluation was performed on four web site designs, with a slight variation of the fourth design included as well. The prototypes A, B, C, and D below are not provided in any particular order, and D2 is not shown. 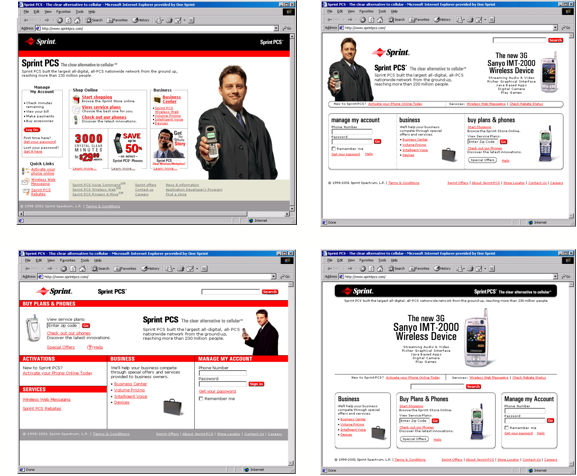  Research Design
Accomplishments
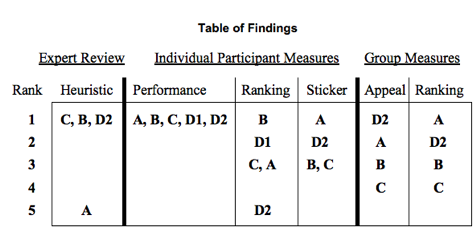  The key finding was that performance was found to be equal, leaving the heuristic review to drop web site A from the final competition, but allowing other influences from the site to impact the final UI design. The key finding was that performance was found to be equal, leaving the heuristic review to drop web site A from the final competition, but allowing other influences from the site to impact the final UI design.
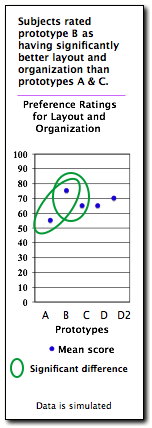
Building on That Usability practitioners understand well that how a user performs on a task can be very different than how they feel about a task. As the Marketing group was a key stakeholder in this project, I brought the results to them in the form of a presentation on the difference between performance and preference. In several pages, I put different, colored pictures of the Charlie Brown Snoopy character (by Charles M. Schulz), clearly visible amongst the data and visuals. On one page, I intentionally placed a very small black and white Snoopy.  As the presentation went on (large screen projection) the person that called out "Snoopy" first when they saw one was given a candy prize. Once we hit the page with the small, unobtrusive Snoopy, the room was quiet. Just before I was to change the slide, one individual finally exclaimed "Snoopy!" They were given the prize to the astonishment of everyone else in the room. At the end of the presentation, I provided them with the chart seen below. Given a large group, the expectation is that there will be more evenly distributed preference rankings. In the performance column, the expectation is that there will be many fewer that saw the very small, well hidden black and white snoopy. The closing line went something like, "So while you look at a user interface and judge it quickly based upon whether you like it or not aesthetically, how well a customer performs at a site may be quite a different story." As the presentation went on (large screen projection) the person that called out "Snoopy" first when they saw one was given a candy prize. Once we hit the page with the small, unobtrusive Snoopy, the room was quiet. Just before I was to change the slide, one individual finally exclaimed "Snoopy!" They were given the prize to the astonishment of everyone else in the room. At the end of the presentation, I provided them with the chart seen below. Given a large group, the expectation is that there will be more evenly distributed preference rankings. In the performance column, the expectation is that there will be many fewer that saw the very small, well hidden black and white snoopy. The closing line went something like, "So while you look at a user interface and judge it quickly based upon whether you like it or not aesthetically, how well a customer performs at a site may be quite a different story."I've added simulated data to the table below. Feel free to use it for your own presentation where this might come in handy. Please be sure to include the credit for Mr. Schulz.
And Did You Experience the Same? The impact of the UI design on this page may have had the same affect on you. Note the table below.
Which of these do you know you remember seeing? The same tactic as in the Snoopy presentation was used on this page. Which of the items do you prefer? While you may not have preferred the black one, you may not have known it was on the page at all. If you missed it, it was because it was designed to be that way. So, preference is not performance, and you just experienced it. Skills
|
More... Usability Testing
|
||||||||||||||||||||||||||||||||


 Snoopy images belong to Charles M. Schulz
