 |
|
||||||||||||
|
|
|||||||||||||
 |
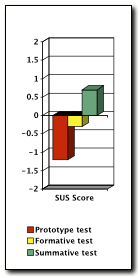
Measuring the User Experience using a Common Tool Overview The SUS is nothing new for those that have been around the block for a while, but it's worth the time to list it here as a tool that I have used. In order to measure overall usability, the System Usability Score (SUS), a no cost, subjective usability scale, can be employed to understand differences in study variables as well as act as a benchmark overt time for the same product (note example data on the left). When used in the same domain over time, it is recommended that the score be normalized to account for changing customer expectations. For more on the SUS, please see Wikipedia on SUS as a starting point. Research Design Below I have provided an example of the SUS questions. Below are tow examples of when you might use the SUS.
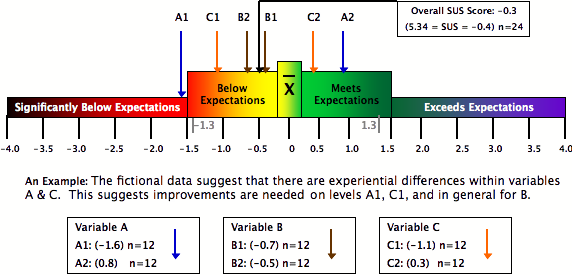
A Hypothetical Example The example below shows how the SUS can be helpful in locating the factors that need redesign or functional improvement. In this example, we can see that Factor A really splits on the scale. If Factor A were two user types, then a more detailed look at the group that rated the system below expectations is warranted. Of course, Factor A could be anything used in the study as an experimental variable. The SUS operates on a normal distribution (bell curve). I have taken a bit of poetic license with my graphic to show that we are often interested in two concepts as it relates to the progression of a SUS score.

Building on That While the SUS is a great tool, it should not be taken as the generic measure that should be used in all of your studies. Like all measures, it is useful when there is need to understand how the product or service is perceived as a single user experience. As user experience practitioners, it is to our advantage to use the SUS when appropriate, and bail on it when it really doesn't meet our needs. |
More... UX Measurement Activities |
|||||||||||